
Writers, editors, SEOs, we all face the same quiet frustration.
We sit down to write about something we know well… and yet we can’t see the full picture.
We know the keywords, we have the tools, but we don’t really see the topic, its structure, its missing parts, its meaning in context.
That’s the gap Topicstotalkabout was built to close.
The Problem Is We Don’t Understand Our Topics Deeply Enough
Most SEO and content tools are designed for volume, how often a phrase is searched, how hard it is to rank, how competitors use it.
But none of that tells you what the topic is, what entities define it, what conversations surround it, or how ideas connect below the surface.
Writers end up guessing.
Strategists repeat the same subtopics everyone else covers.
And search engines, powered by entity-based understanding, can tell the difference.
The result is what we call semantic shallowness, content that looks fine on the surface but carries weak meaning.
Why This Matters for Content Professionals
If you’ve been creating content for years, you’ve probably felt one or more of these pain points:
- You’ve written great articles that never ranked, and you don’t know why.
- You’ve covered “everything,” but your site still doesn’t build topical authority.
- You keep discovering subtopics after publishing, when it’s too late.
- You struggle to explain to clients or editors why certain topics matter or how they connect.
The truth is taht you’re not missing keywords.
You’re missing semantic visibility, the ability to see the landscape of meaning before you start writing.
That’s what Topicstotalkabout gives you.
The Real Benefit Is Seeing How Ideas Connect
Topicstotalkabout (TTTA) doesn’t tell you what to write next.
It shows you how your topic thinks.
When you enter a term, say, “renewable energy”, the system looks beyond search volume or keyword density.
It identifies related entities, concept clusters, and conversation patterns across sources like Wikipedia, Wikidata, and semantic networks.
You don’t just get a list.
You get a map, a visual of how knowledge around your topic is structured, where it’s dense, and where it’s missing.
That’s the moment when a strategist starts thinking like an architect andnot just a guesser.
How TTTA Fits Into Real Workflows
For writers and SEOs, Topicstotalkabout acts as a thinking partner before the writing begins:
- For content creators: it reveals context you’d otherwise miss, the supporting ideas, entities, and relationships that make a topic complete.
- For strategists: it provides a visual foundation for content clusters, internal linking, and knowledge-driven planning.
- For educators or researchers: it’s a fast way to see how a concept is understood in the broader web of knowledge.
In short – TTTA replaces intuition-only research with structured exploration.
Why a Visual Map Changes Everything
A list of keywords is like a shopping list, it tells you what to get, not why or how things fit together.
A map, on the other hand, gives you spatial understanding.
You can see related topics forming clusters, central nodes attracting context, and lonely ideas that deserve deeper content.
That’s how professionals detect content gaps and opportunities, not by guessing trends, but by understanding meaning.
The Simplicity Behind It
For all its logic and data, TTTA starts in the simplest possible way:
a clean interface, one field, one question:
What do you want to understand?
You type your topic, hit Explore, and that’s it.
From that one seed, the system starts building your semantic map, entity by entity, concept by concept.
The Map Helps In Seeing How Meaning Organizes Itself
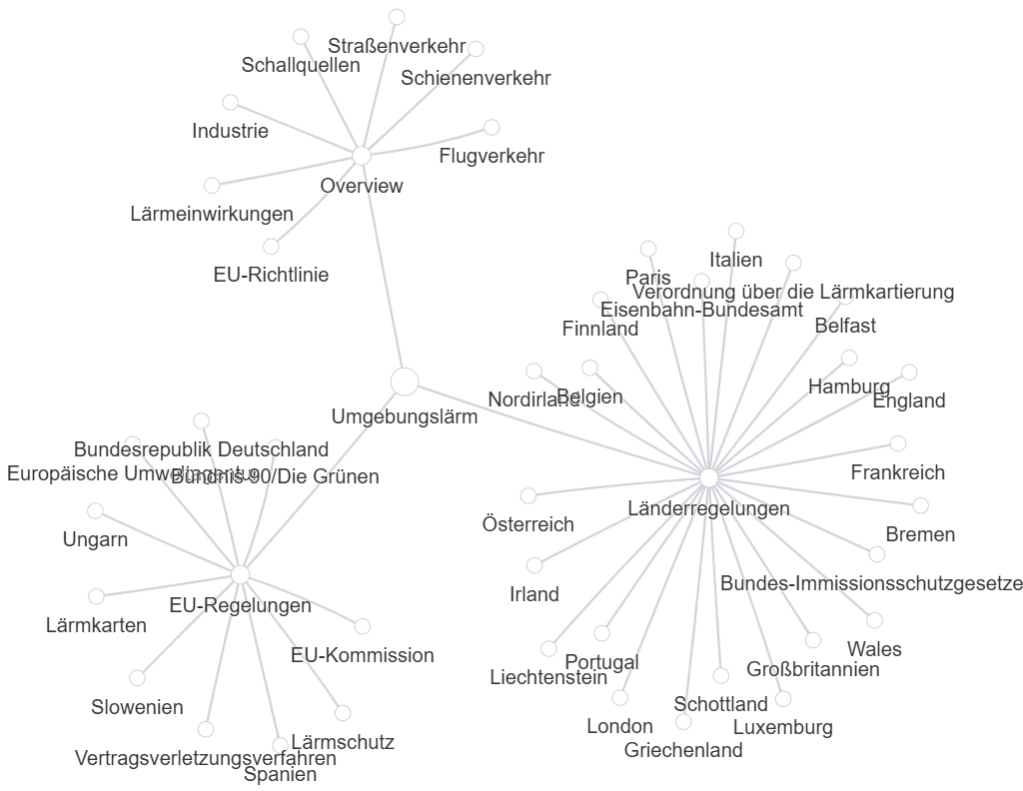
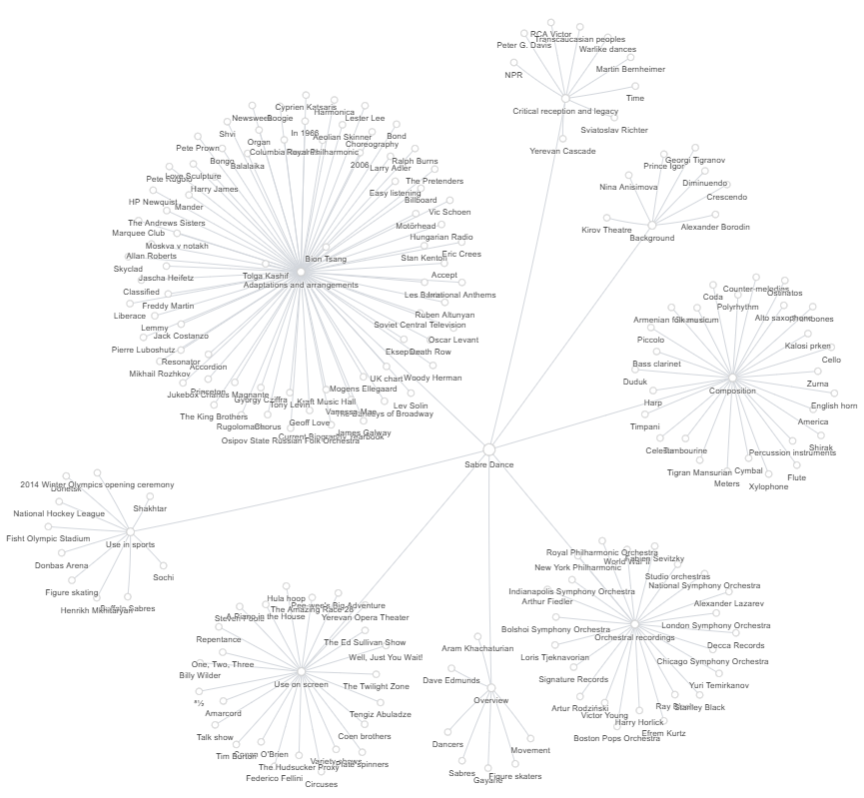
When the analysis begins, what you see first is not a chart, it’s a structure coming to life.
Every topic you enter becomes a small semantic universe, made up of entities (the building blocks of meaning) and the relationships that connect them.
Each entity on the map, whether it’s a person, concept, technology, or event, is represented as a node.
The connecting lines between them are semantic bridges: invisible in normal text, but crucial to how knowledge is organized.
This is where the core idea behind Topicstotalkabout takes shape – you’re generating data and you’re revealing structure.
How Entities Appear and Interact
Every node you see on the map has its own story.
Some are core entities, directly linked to your main topic and rich in references across the web.
Others are supporting entities, orbiting close, providing detail, examples, or context.
And then there are bridge entities, the ones that connect clusters that don’t seem related at first glance.
E.g., if your topic is “renewable energy,” you might see clusters like:
- Solar Power (with micro-entities: PV cells, Inverter, Efficiency Ratio)
- Wind Energy (Turbine, Offshore, Capacity Factor)
- Policy & Economy (Feed-in Tariff, Carbon Credit, IEA)
But somewhere in between, you might notice a small connecting node like Storage Technology, an entity that links all three clusters.
That single bridge often reveals new editorial or business opportunities that keyword tools completely miss.
Understanding Size and Distance
The map represents bueautiful and functional language.
Each visual element tells you something about semantic weight and connectivity.
- Node size indicates relevance, the bigger the node, the stronger its connection to the central topic.
- Distance reflects conceptual proximity, close nodes often co-occur in the same semantic contexts.
It’s not decoration but a visual syntax for meaning.
The design follows a simple rule:
“If you can see relationships, you can understand faster than you can read.”
From Visual to Verbal and Back: The Outline Window
Not everyone prefers maps.
Some people think better in text, and that’s where the Outline window comes in.
The Outline is a text-based representation of the same semantic structure you see visually. It lists your entities hierarchically, grouped by context and relevance.
Example:
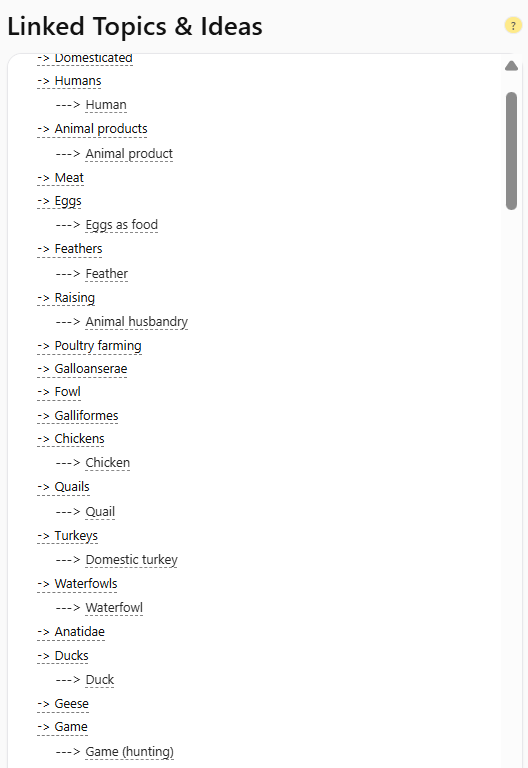
It’s essentially the same map, turned inside out.
You can scroll, expand, or copy from it, perfect for planners, strategists, or anyone who prefers linear data to visual noise.
The Outline is also where many users begin to sketch their content plan:
headlines, clusters, article ideas, all of it grows naturally out of this structured outline.
Why Two Representations Matter
The map and the outline are two views of the same truth.
The map shows how ideas connect in space.
The outline shows how they can be expressed in sequence.
Writers think in outlines.
Machines think in graphs.
By giving you both, Topicstotalkabout bridges human understanding with machine logic, turning abstract meaning into something you can see and use.
That’s the moment most users describe as the click, when their topic stops being a fuzzy cloud of associations and becomes a living system they can navigate.
How Meaning Becomes Data: Triples and Predicates
When you look at the map in Topicstotalkabout, what you’re really seeing is the visible surface of something deeper: a semantic graph.
Underneath it, everything is stored and connected as triples, small sentences of meaning that machines can read and reason about.
It’s the oldest and most elegant way of describing knowledge digitally.
And it always follows the same simple logic:
subject → predicate → object
This structure is called an RDF triple (Resource Description Framework).
It’s not about databases or code, it’s about relationships.
Let’s unpack that.
What RDF Triples Actually Are
Every triple expresses one fact, one piece of meaning.
You can think of it as a small, declarative sentence.
Example:
“Solar Power”, uses → “Photovoltaic Cells”
“Wind Energy”, depends on → “Turbine Technology”
“Feed-in Tariff”, influences → “Renewable Adoption”
Each one of these is a triple:
- Subject: the thing we’re describing.
- Predicate: the type of relationship or action.
- Object: the thing connected to it.
Individually, they look simple.
But when you have thousands of them, meaning starts to behave like a network.
Patterns emerge. Relationships repeat. And context, that elusive layer humans grasp instantly, becomes something machines can calculate.
That’s the foundation of the semantic web, a web of meaning instead of a web of links.
Why Predicates Matter More Than Nodes
Entities alone don’t make knowledge.
You can list hundreds of people, companies, or technologies, but until you describe how they relate, you don’t have understanding.
Predicates are what make the map alive.
They define the logic of connection.
Typical predicate types include:
- is a / type of → classification (“Hydropower” is a “Renewable Energy Source”)
- part of / belongs to → hierarchy (“PV Cells” are part of “Solar Systems”)
- depends on / requires → dependency (“Wind Energy” requires “Turbine Technology”)
- influences / affects → causal or directional (“Policy” influences “Adoption”)
- similar to / contrasts with → comparison (“Bioenergy” contrasts with “Fossil Fuels”)
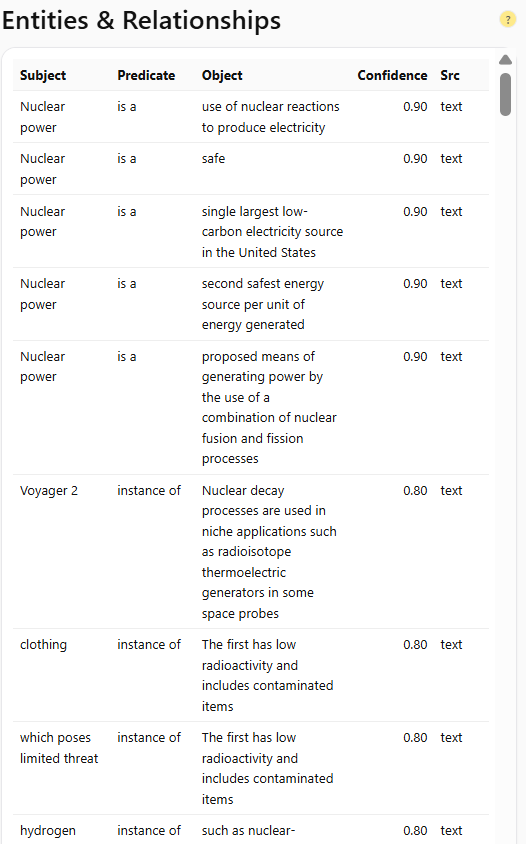
In Topicstotalkabout, these relationships are detected, weighted, and used to decide which nodes belong close together, not just visually, but conceptually.
How Topicstotalkabout Uses Triples and Predicates
When you type a topic, the system starts collecting references from structured sources (like Wikipedia’s RDF data, Wikidata, and open knowledge bases).
Each reference becomes a candidate triple:
Topic: "Renewable Energy"
├─ uses → "Solar Power"
├─ includes → "Wind Energy"
├─ regulated by → "IEA Policies"
├─ affects → "Carbon Emissions"
Then TTTA applies several layers of logic:
- Relevance weighting: predicates that appear frequently across trusted sources are given stronger weight.
- Context coherence: if multiple predicates connect the same two entities, the relationship is strengthened.
- Semantic compression: redundant or trivial links (like “is related to”) are simplified into higher-level predicates.
The outcome isn’t a random cloud of terms. The real outcome is a knowledge graph, where every connection has purpose and every edge tells a story.
Why This Approach Matters for Writers and SEOs
Understanding triples and predicates is what separates surface-level keyword content from entity-driven strategy.
When you build content without understanding relationships, you’re writing disconnected nodes, pages that mention the same topic but never interact.
When you think in predicates, you start to design information architecture intentionally.
For example:
If your site covers Renewable Energy, you might create:
- “What is Renewable Energy?” → the root node.
- “How Solar Power Works” → connected via includes.
- “Feed-in Tariffs and Policy Impact” → connected via affects / regulated by.
- “Storage Technology and Grid Integration” → connected via depends on.
That’s not just content planning, it’s semantic modeling.
Inside TTTA: The Predicate Layer
In Topicstotalkabout, predicates aren’t static labels. They’re dynamic, living connectors, derived from language patterns and knowledge graph data.
When you hover over a line in the visual map, you’re not just seeing “A → B.”
You’re seeing the kind of relationship, the predicate, that holds them together.
Some predicates are generic (like related to), others are specific (like published in, measured by, founded after).
The system prioritizes the latter, because specificity builds structure.
That’s why two maps built around similar topics can look entirely different:
not because the entities change, but because the predicates tell a different story.
From Data to Discovery
The magic of this system is in letting you see how data expresses meaning.
A single new predicate can reveal a missing angle, a potential new article, or an unexplored link between disciplines.
Writers often describe this as the “aha moment”: the instant when they realize they’ve been treating topics as lists of nouns, when in reality, meaning lives in the verbs between them.
That’s what predicates are – the verbs of understanding.
Understanding Context: How Entities Find Their Meaning
An entity by itself means almost nothing.
“Apple” could be a fruit, a company, or a record label, until you place it in context.
That’s why every entity in Topicstotalkabout lives not in isolation, but inside a semantic environment that defines what it means here and now.
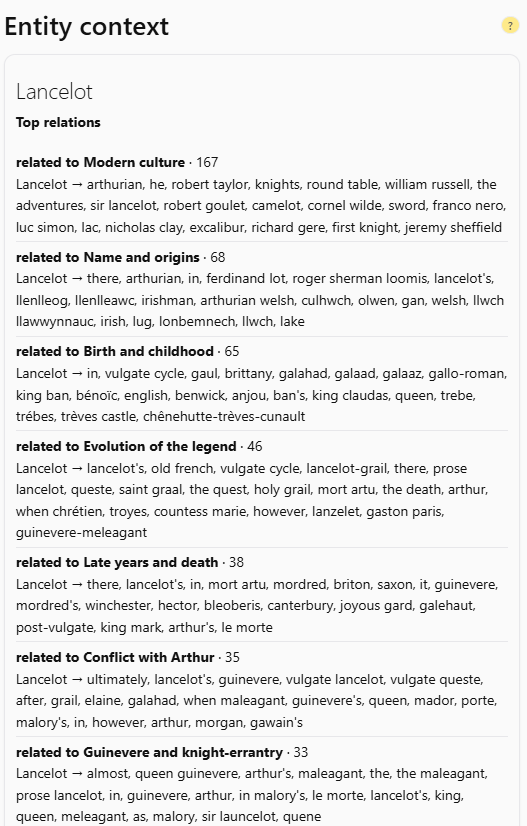
This is called entity context, the dynamic frame that gives each node its correct identity and relevance.
Without context, even advanced NLP models confuse meanings.
With it, patterns emerge, precision increases, and topics stop being lists of ambiguous nouns.
How Entity Context Works in Topicstotalkabout
When TTTA analyzes a topic, it doesn’t just extract entity names. It also studies their linguistic and relational surroundings, the other entities, predicates, and clusters that co-occur with them. These surrounding signals are what we call context vectors.
Each entity’s context vector is like a fingerprint of meaning, unique, adaptable, and full of subtle signals.
For example:
| Entity | Context Clues | Likely Meaning |
|---|---|---|
| Apple | Cupertino, iPhone, Tim Cook | Company |
| Apple | Vitamin C, Orchard, Fiber | Fruit |
| Apple | The Beatles, Abbey Road, 1968 | Record label |
The same label, but three completely different semantic realities.
This is the foundation of how TTTA maintains accuracy in its maps, by learning what kind of world each entity belongs to, before deciding where to place it.
Context Is Relational, Not Textual
Context doesn’t live in sentences, it lives in connections.
A single mention of “Solar Panel” tells you very little.
But once it connects to PV efficiency, inverter types, installation cost, and feed-in tariffs, its identity becomes precise:
not just a device, but a technology within an energy system.
This is why Topicstotalkabout treats entity context as a network property rather than a local one.
Meaning emerges from position, from the way a node is linked, not just the words that surround it.
Concept Neighborhoods: Where Ideas Live Together
If entity context defines who an entity is, then concept neighborhoods define where it lives.
A concept neighborhood is a cluster of closely related entities and subtopics that share overlapping context vectors.
In other words: ideas that naturally belong near each other.
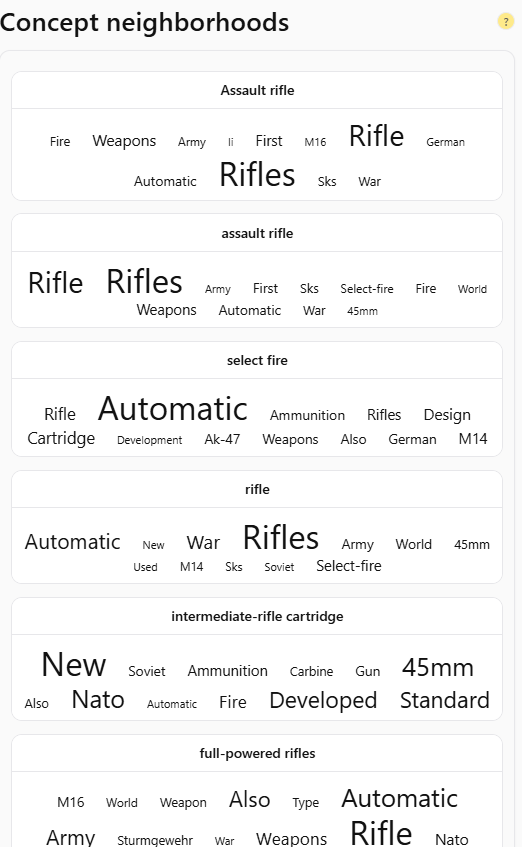
E.g. within the broader topic “Artificial Intelligence,” you might find several concept neighborhoods:
- Machine Learning Methods – Gradient Descent, Neural Networks, SVM, Overfitting
- AI Applications – Image Recognition, NLP, Predictive Maintenance, Chatbots
- Ethics & Policy – Bias, Explainability, Regulation, Transparency
- Hardware & Infrastructure – GPUs, TPUs, Model Parallelism, Energy Consumption
Each of these clusters represents a neighborhood, an area of meaning where entities reinforce one another.
When TTTA builds the map, it identifies these neighborhoods automatically, using the density of shared predicates and contextual overlap.
Why Concept Neighborhoods Matter
Concept neighborhoods are the architecture of topical authority.
If your website, course, or publication consistently covers all the major neighborhoods within a domain, you’re not just “doing SEO”, you’re building a semantic ecosystem.
Each neighborhood can evolve into a content cluster or knowledge domain:
- Strong internal links within a neighborhood boost coherence.
- Smart bridges between neighborhoods create depth.
- Monitoring new entities entering a neighborhood signals emerging trends.
In other words, neighborhoods help you see not just what’s connected, but where the conversation is growing.
Dynamic Context and Shifting Neighborhoods
Entity context isn’t static – meanings drift as the world changes, and with them, the shape of their neighborhoods.
Take “AI Safety.” Five years ago, its neighborhood was filled with words like robustness, control, testing. Today it overlaps with ethics, governance, existential risk, and alignment.
Topicstotalkabout updates these semantic positions dynamically.
That’s how it captures living meaning, the evolving way the internet talks about a subject.
This matters because semantic freshness is now a ranking factor.
Not in the sense of publishing new articles, but in keeping your concept graph aligned with current reality.
How You Can Use This in Practice
Understanding entity context and concept neighborhoods helps you:
- Plan content clusters that are both comprehensive and coherent.
- Detect drift when articles start mixing entities from unrelated neighborhoods.
- Discover opportunities where two neighborhoods intersect but no one’s written about that link yet.
- Explain strategy visually, to clients, teams, or stakeholders, with data-backed semantic logic.
That’s the quiet power of TTTA’s design: you explore meaning and you see where it lives.
Word Stats and Phrase Stats: Seeing Language Inside the Topic
Meaning lives in connections, but language still leaves measurable traces.
Behind every entity, predicate, and semantic bridge in Topicstotalkabout lies another analytical layer, Word Stats and Phrase Stats, a linguistic snapshot of how a topic is expressed on the web.
If the map shows what exists and how it connects,
Word and Phrase Stats show how it’s talked about.
Why Analyze Words and Phrases
Even though TTTA builds meaning primarily through entities, much of the nuance, tone, emphasis, and emerging relevance, still lives in raw text.
And no corpus captures that better than Wikipedia, because it reflects both human writing and structured knowledge.
When TTTA analyzes a topic, it extract entities from Wikipedia’s RDF.
It also examines the unstructured surface of the article, the words and phrases that appear in specific sections such as the lead paragraph, headings, body text, and infobox.
Each of these contexts carries a different semantic weight.
This approach helps us quantify linguistic importance without losing connection to structure.
How Word Stats Work
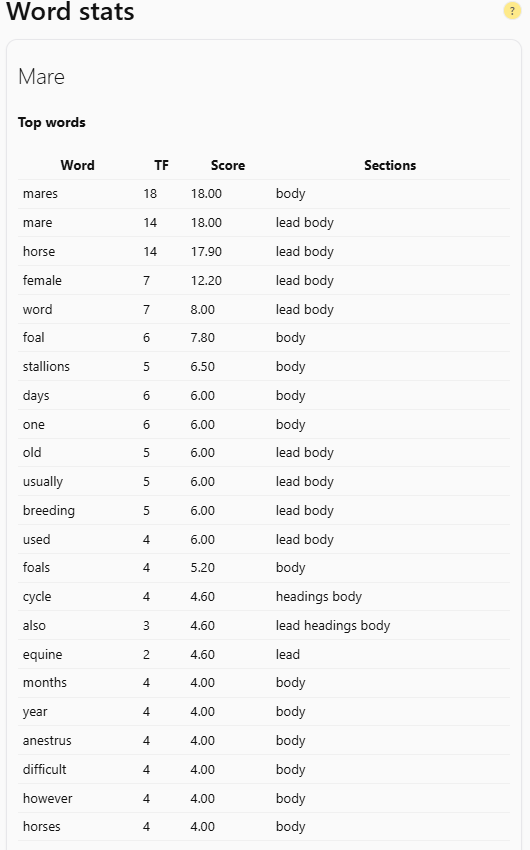
Word Stats represent the statistical backbone of a topic’s vocabulary.
For every analyzed Wikipedia article related to your topic, TTTA counts how often each word appears and where it appears.
The system then calculates a composite Word Score, based on weighted section positions:
- Words in the lead paragraph carry the highest weight, they define what the article is about.
- Words in headings reinforce hierarchy and structure.
- Words in the body contribute to context and depth.
- Words in the infobox signal formal attributes or categorical relevance.
An example (simplified):
| Word | Frequency | Weighted Score | Section Distribution |
|---|---|---|---|
| energy | 138 | 0.92 | lead, body |
| renewable | 95 | 0.88 | lead, headings |
| grid | 34 | 0.64 | body |
| subsidy | 18 | 0.55 | headings |
| battery | 16 | 0.49 | body |
This allows TTTA to distinguish between core terms (those central to the definition) and supporting terms (those that belong to context or examples).
It’s language turned into structure.
How Phrase Stats Extend the Picture
Single words reveal vocabulary.
Phrase Stats reveal how concepts combine.
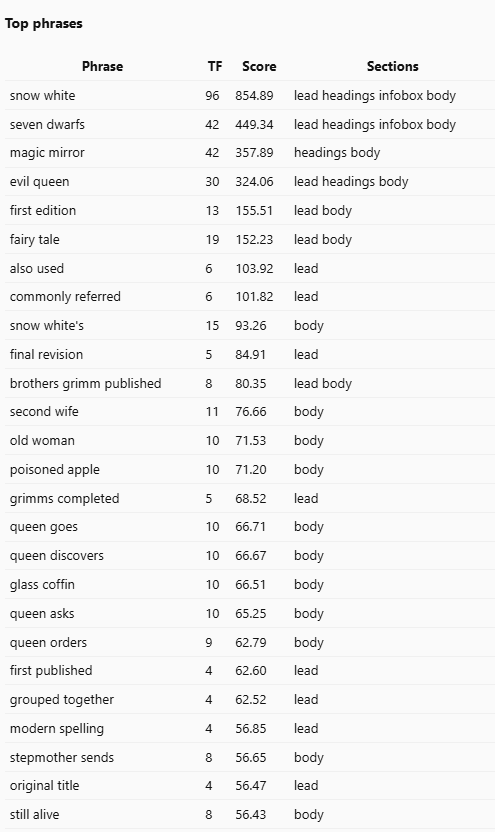
TTTA scans the same Wikipedia text for recurring two- to five-word sequences, phrases that appear frequently enough to suggest established usage.
Then, using the same positional weighting (lead, headings, body, infobox), it assigns each phrase a Phrase Score that reflects both frequency and placement strength.
Example output for machine learning:
| Phrase | Frequency | Weighted Score | Section Presence |
|---|---|---|---|
| supervised learning | 62 | 0.91 | lead, headings |
| training dataset | 41 | 0.84 | body |
| feature extraction | 28 | 0.76 | body |
| overfitting problem | 19 | 0.68 | body |
| explainable AI | 12 | 0.59 | headings |
The higher the score, the more structurally important the phrase is to the topic.
If it appears in the lead and headings, it’s likely definitional.
If it lives mostly in the body, it’s contextual or technical.
Infobox mentions often indicate formal categorization, like country names, organizations, or standards.
What This Data Tells You
By combining Word and Phrase Stats, TTTA shows the linguistic skeleton of a topic, what words dominate its definition, what appear in supporting context, and what terms are underrepresented.
You can use these insights to:
- Identify key terminology that should appear in your own coverage.
- Detect missing language in your content, terms experts use but you don’t.
- Understand structure, how Wikipedia (and by extension, collective knowledge) organizes meaning through text.
- Spot emerging terminology, when phrases appear mainly in body text but start creeping into leads and headings over time.
Why This Matters for Writers and Strategists
Search engines and AI models learn from structured and semi-structured text, Wikipedia being one of their strongest signals.
By analyzing how a topic is linguistically constructed there, TTTA helps you align your own language with the web’s established understanding.
That doesn’t mean copying Wikipedia.
It means speaking the same semantic dialect, using the right words in the right structural places.
If your article on quantum computing never mentions superposition or qubit coherence, and those appear in the lead sections of dozens of authoritative pages, you’re signaling a gap.
TTTA makes that visible before you hit publish.
The Core Benefit is the Quantified Context
Word Stats and Phrase Stats together create something rare: a measurable model of how a field defines itself through language.
They turn unstructured text into structured linguistic data, connecting the surface of writing to the depth of meaning.
You can finally see not just what the topic is about, but how it talks about itself.
And that’s where true semantic alignment begins, with contextual vocabulary weighted by meaning.
Semantic Bridges and Betweenness: Let Us Find the Hidden Connectors
Every topic map has its stars, the large, central nodes that everyone recognizes.
But what often carries the most strategic value are not those giants, but the quiet connectors between them.
These are what we call semantic bridges: entities or concepts that link otherwise separate clusters of meaning.
They may not be frequent or famous, but they hold the structure together, the way a single bridge can connect two entire continents of thought.
Topicstotalkabout doesn’t just visualize these connections.
It measures them, using a concept from network theory called betweenness centrality.
What Betweenness Centrality Means
In a graph, betweenness measures how often a node lies on the shortest path between other nodes.
It’s a mathematical way of saying: “How many conversations depend on this idea to connect?”
- A node with high degree is popular, it’s linked to many others.
- A node with high betweenness is influential, it connects groups that otherwise wouldn’t interact.
These two are not the same thing.
A node can be mentioned rarely but still matter enormously if it bridges two important regions of meaning.
Example:
In a topical map about renewable energy,
- “Solar Power” and “Wind Energy” are high-degree nodes.
- But “Energy Storage” or “Smart Grid” might show high betweenness, because they connect the technical and policy clusters.
Without them, your topic splits in two.
How TTTA Detects Bridges
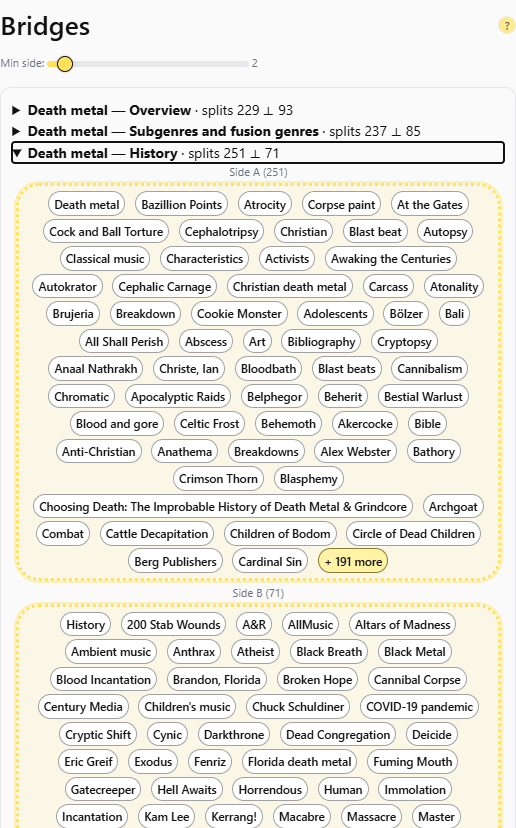
When you generate a map in Topicstotalkabout, the system calculates centrality scores for every node in the semantic network.
This includes:
- Degree Centrality – how many connections the node has.
- Closeness – how near it is to all others (semantic distance).
- Betweenness – how often it acts as a bridge between otherwise distant clusters.
TTTA visualizes these metrics directly:
- Bridge nodes are highlighted by subtle changes in color saturation or node outline.
- Hovering over one shows which clusters it connects and through which predicates.
The algorithm prioritizes clarity over density: a few strong bridges are worth more than dozens of weak ones.
Why Bridges Matter in Content and SEO
From a semantic perspective, bridges are where new meaning happens.
They connect worlds, technology and policy, science and ethics, product and user behavior.
For SEOs and strategists, identifying bridge entities brings several tangible benefits:
1. Discover New Content Angles
Bridges often reveal underexplored intersections, the topics no one covers yet because they sit between established domains.
Example: “AI Ethics in Supply Chain Management”, a bridge between two dense but separate areas.
2. Strengthen Internal Linking
In website architecture, pages that embody bridge concepts are perfect internal link hubs.
They connect different clusters of your content, signaling topical completeness and logical cohesion.
3. Build Authority Across Niches
Covering bridges positions your site as a connector of disciplines, the kind of content that earns natural backlinks and user trust.
In the eyes of algorithms, this looks like semantic versatility, you understand how things relate beyond simple categories.
4. Detect Content Silos
If your map shows strong clusters but few bridges, it’s a warning sign.
Your content may be over-optimized within narrow areas, leaving gaps between disciplines.
Strategically adding content around high-betweenness entities helps unify the knowledge architecture of your site.
Bridges as Creative Triggers
For writers, bridge entities are gold.
They’re where curiosity lives, the connecting ideas that make readers think, “I’ve never seen it framed that way before.”
A good bridge concept naturally suggests storytelling formats:
- comparative articles (“How Cybersecurity Shapes Modern AI Ethics”),
- synthesis pieces (“When Biology Meets Computing”),
- or even conversation starters (“What Energy Storage Teaches Us About Policy Design”).
Bridges are where information becomes insight.
How TTTA Makes Betweenness Actionable
TTTA doesn’t expect you to interpret the math.
It translates betweenness into visual and textual cues:
- In the map, bridge nodes stand out visually, positioned between clusters, often glowing slightly brighter.
- In the outline, they’re tagged or highlighted as cross-domain connectors.
- In stats, you can sort or filter entities by bridge strength to find new opportunities instantly.
This transforms what’s normally a complex graph metric into something creative professionals can use, a way to see the semantic arteries of their domain.
From Structure to Strategy
Understanding bridges changes how you think about topics altogether.
You stop asking “what’s trending?” and start asking “what connects?”
That’s the core of TTTA’s philosophy:
Meaning doesn’t live in isolated ideas, it flows along the paths between them.
And when you learn to see those paths, the bridges and the betweenness that hold them – you write better content and also you begin to understand how knowledge itself organizes, moves, and grows.
Seeing the Whole Picture: What the Map Teaches Us
Topicstotalkabout isn’t another SEO gadget chasing rankings. It’s rather a way to see what your topic actually is, how it connects, breathes, and organizes itself.
You start with a single word.
The system turns it into a landscape: entities, predicates, bridges, clusters, and context neighborhoods, all extracted from Wikipedia, one of the richest open sources of structured human knowledge.
What you see on screen is a model of understanding, a semantic echo of how the web itself describes that idea.
And all of it is free!!!
A Free Tool with Deep Insight
Topicstotalkabout (TTTA) is built to be accessible, a free, web-based ideation tool for anyone who writes, plans, or thinks in topics.
Despite being open and simple on the surface, it often delivers insights that even paid platforms overlook, because it focuses not on data volume, but on semantic structure.
Writers use it to find clarity before they start.
SEOs use it to spot missing entities and content gaps.
Strategists use it to explain to clients why certain topics belong together.
And educators use it to visualize abstract ideas and teach context itself.
What TTTA Is, and What It’s Not
TTTA doesn’t crawl your website or audit your on-page SEO.
It doesn’t measure traffic or rank positions.
Instead, it acts as a semantic ideator, a thinking companion that helps you understand what a topic consists of before you apply optimization or strategy.
Because it builds its insights from Wikipedia and structured public knowledge, it’s neutral, explainable, and reusable across languages and domains.
While it’s not a replacement for specialized tools like entity extractors, content gap analyzers, or search intent models.
It’s the first step, the foundation of understanding you combine with other instruments.
Working Together with the Rest of Your Stack
To get the most out of TTTA:
- use it before writing, to define structure, hierarchy, and missing concepts,
- use dedicated semantic SEO tools afterwards, to fine-tune your on-page entities, schema, and topical authority,
- and revisit TTTA later, to discover new connections as your content ecosystem grows.
This loop, map → write → optimize → map again, is what turns ordinary content planning into semantic thinking.
In the End, It’s About Meaning!
Every tool counts something different: clicks, ranks, links, keywords.
Topicstotalkabout counts meaning. And meaning is the only one metric the web, and your readers, never stop caring about.
Leave a Reply